


SHeFI Re-calibration (March - June 2014)
Background
As a result of several hardware and software interventions to the SHeFI instrument, the antenna temperature scale TA∗ applied to the data has been incorrectly calibrated between March 2014 and June 13th 2014.
After a hardware upgrade on the instrument in mid-March 2014, which also comprised a replacement of the cold IF amplifiers, the receiver chain response to the calibration loads was not linear anymore. This introduced a calibration error in the science data taken afterwards. Several attempts have been made to solve this, e.g. by inserting some attenuation at the input of the warm IF processor. Therefore data taken after April 23rd have a smaller calibration error. Only on June 13th, when the HEMT amplifier parameters could be re-adjusted, the instrument was back operating in its linear range. After that date (more exactly after ∼17UT that date, scan# 32825), measured intensities on sky went back to reasonable values.
As a consequence, all data taken in this period need to be rescaled, applying different calibration factors for the periods March to April 23rd 2014, and April 23rd to June 13th 2014. Note that the calibration factors do not only depend on the observation date, but also on frequency, sideband, and probably a few other factors. See the SHeFI re-calibration Q&A below.
Re-calibration factors
The following tables give the numbers we recommend in order to re-calibrate the SHeFI data, together with some additional information. The table for each receiver (APEX-1, APEX-2, and APEX-3) is ordered by rest frequency, and separated in LSB tuning (light green background) and USB tuning (light blue background).
The columns "Intensity ratios" give the ratios of measured line intensities for a given frequency during one of the two periods, relative to line intensities not affected by the calibration issue (measured after June 13th 2014). The columns "Recommended factor" give the re-calibration factors, i.e. the factors with which the spectra have to be multiplied. In some cases, we recommend different factors for the two backend groups of the XFFTS - this is mentioned in the table.
The column "Method" gives the method through which the re-calibration
factor was measured (as reciprocal of the measured intensity ratio)
and/or the method by which the recommended factor was estimated.
The possible methods are listed below:
(a) from integrated intensity measurements for CO lines only,
from our line pointing monitoring program.
(b) from intensity measurements through a line fit or integration, done for all
frequencies which were part of our calibration plan.
(c) from individual line fits, but usually less certain than (a) or (b) since
the lines may be weak (for target sources) or off the center of the IF
(for IRC+10216).
(d) from whole spectrum fits: a fit over the whole IF spectrum of line-rich
calibrators (SgrB2(N) or OMC1). The largest uncertainty here is the correct
baseline subtraction.
(e) through an indirect method: relative rms, receiver temperature ratios,
from image band lines etc.
(f) through intra- or extrapolation from values at close LO frequencies.
The entry fields under "Recommended factor" which have a light red background are those where science observations exist for a given frequency and period, i.e. those where a re-calibration factor is needed by the PI.
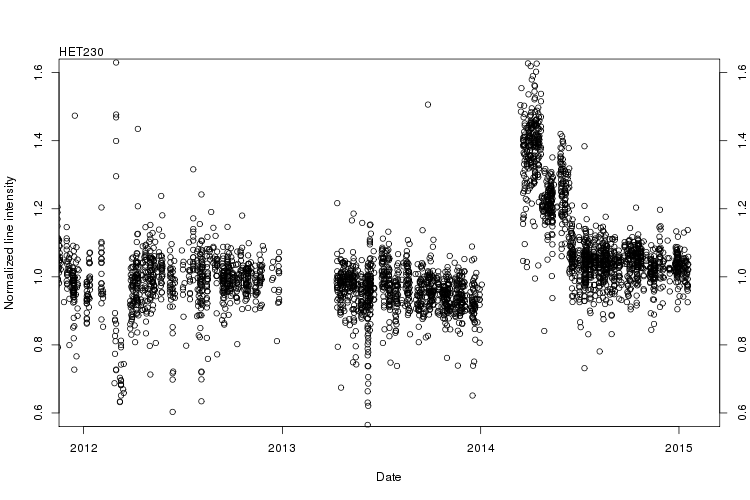
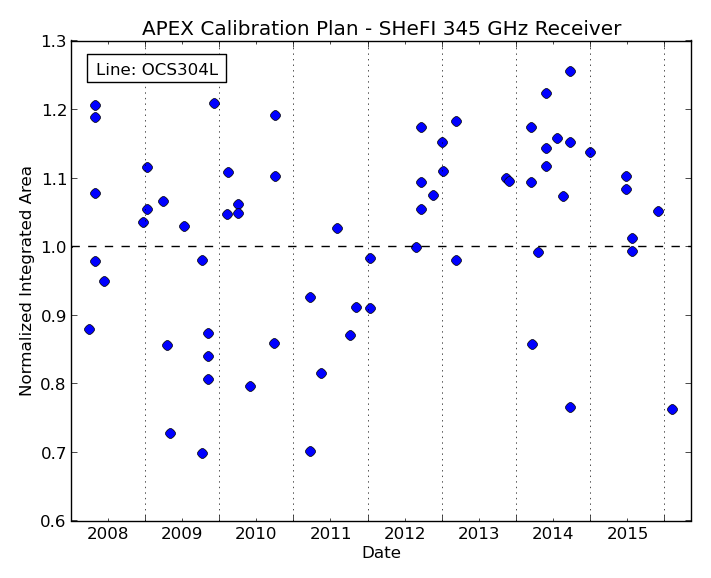
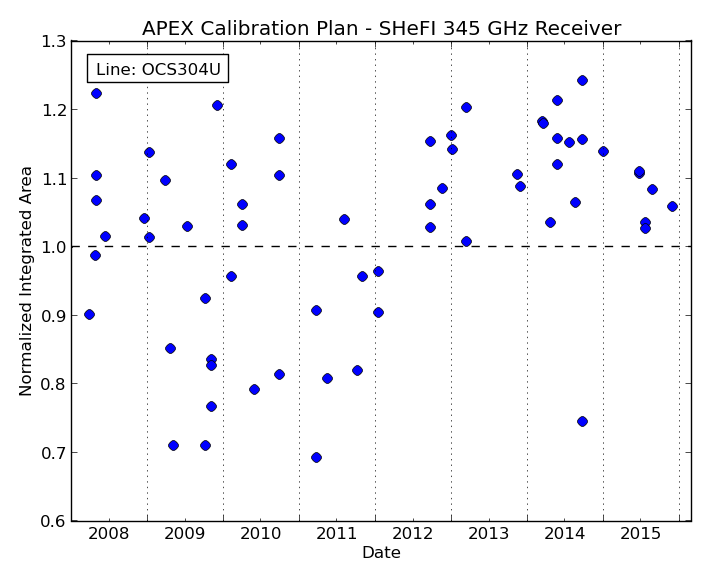
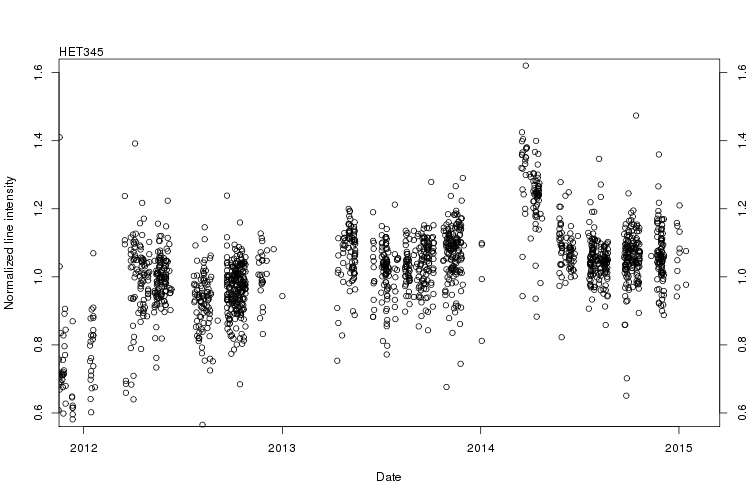
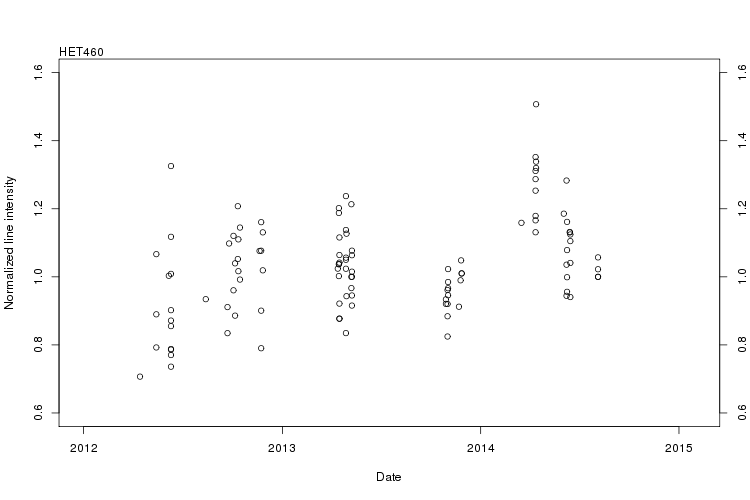
The table also contains links to plots of the normalized intensities with time for the calibration plan sources and the line pointings. These plots contain data since 2008 (for the calibration plan) and 2012 (for the line pointings) and are just for reference to illustrate the changes and uncertainties of the measured intensities over the years. As explained further below, data from before 2014 are not used to obtain re-calibration factors.
APEX-1 (HET230)
| Frequency | Linename | Sideband | LO Frequency | Intensity ratios | Method | Recommended factor | Comments | ||
|---|---|---|---|---|---|---|---|---|---|
| [GHz] | [GHz] | 20/03-23/04 | 23/04-13/06 | 20/03-23/04 | 23/04-13/06 | ||||
| 213.5 | CO(7-6) (z≠0) | LSB | 219.5 | -- | -- | (f) | 0.76 | -- | |
| 216.1 | DCO+(3-2) | LSB | 222.1 | -- | -- | (f) | -- | 0.87 | |
| 218.2 | H2CO(3-2) | LSB | 224.2 | 1.30±0.05 | -- | (b) | 0.77 | 0.88 | |
| 218.8 | SiO - 13CO | LSB | 224.8 | 1.20±0.14 | 1.12±0.10 | (c,d,f) | 0.83 | 0.89 | Factor for BE group 1 (-X201): 0.73 / 0.80 for the 2 periods respectively; for BE group 2 (-X202: 0.90 / 0.95.1 |
| 219.0 | SiO - 13CO | LSB | 225.0 | ||||||
| 219.6 | C18O(2-1) | LSB | 225.6 | 1.24±0.11 | -- | (d,f) | 0.81 | 0.89 | |
| 219.9 | C18O / 13CO | LSB | 225.9 | 1.20±0.11 | -- | (c,d,f) | 0.83 | 0.89 | Factor for BE group 1 (-X201): 0.80 / 0.85 for the 2 periods respectively; for BE group 2 (-X202): 0.86 / 0.93.1 |
| 220.0 | C18O / 13CO | LSB | 226.0 | ||||||
| 220.4 | 13CO(2-1) | LSB | 226.4 | 1.24±0.10 | 1.11 | (b) | 0.81 | 0.90 | |
| 224.7 | C17O(2-1) | LSB | 230.7 | -- | -- | (f) | 0.81 | -- | |
| 226.7 | CN(2-1) | LSB | 232.7 | -- | -- | (f) | -- | 0.91 | |
| 224-230 | CO(2-1) (z≠0) | LSB | 230-236 | 1.1 | 0.9 | (c,f) | 0.81 | 0.91 | |
| 229.5 | CO(7-6) (z≠0) | LSB | 235.5 | -- | -- | (f) | 0.81 | 0.92 | |
| 230.5 | CO(2-1) | LSB | 236.5 | 1.23±0.09 | 1.09 | (b) | 0.81 | 0.92 | |
| 241.8 | CH3OH(5-4) | LSB | 247.8 | 1.15±0.08 | -- | (b) | 0.87 | -- | not observed in science time |
| 243.8 | CO(8-7) (z≠0) | LSB | 249.8 | -- | -- | (f) | 0.88 | -- | |
| 244.9 | CS(5-4) | LSB | 250.9 | 1.12±0.10 | 0.96 | (b) | 0.89 | 1.04 | not observed in science time |
| 255.7 | 2930SiO6-5 | LSB | 261.7 | -- | -- | (f) | 0.90 | -- | |
| 262.1 | CCH(3-2) | LSB | 268.1 | -- | -- | (f) | -- | 1.00 | Absolute calibration uncertainty 15% |
| 227-230 | CO(2-1) (z≠0) | USB | 221-224 | -- | -- | (e,f) | 0.75 | 0.85 | |
| 230.5 | CO(2-1) | USB | 224.5 | 1.33±0.11 | 1.20±0.08 | (a,b) | 0.75 | 0.85 | |
| 231.3 | N2D+(3-2) | USB | 225.3 | -- | -- | (f) | -- | 0.88 | |
| 244.9 | CS(5-4) | USB | 238.9 | 1.30±0.11 | 1.05 | (b) | 0.77 | 0.95 | not observed in science time |
| 257.7 | CO(8-7) (z≠0) | USB | 251.7 | 1.17±0.09 | -- | (d) | 0.85 | -- | measured on OMC1 |
| 259.0 | H13CN(3-2) | USB | 253.0 | -- | -- | (f) | -- | 0.99 | |
| 260.2 | H13CO+(3-2) | USB | 254.2 | 1.5 | -- | (c,f) | 0.90 | 0.99 | measured on science target, but recommended value interpolated |
| 260.5 | 28SiO6-5 | USB | 254.5 | 1.08±0.08 | -- | (d) | 0.93 | -- | measured on OMC1 |
| 262.4 | CO(8-7) (z≠0) | USB | 256.4 | -- | -- | (f) | 0.92 | -- | interpolated |
| 265.9 | HCN(3-2) | USB | 259.9 | 1.09±0.10 | 0.99 | (b) | 0.92 | 1.01 | not observed in science time |
| 266.7 | HCN / HCO+ | USB | 260.7 | -- | -- | (f) | -- | 1.00 | extrapolated |
| 267.6 | HCO+(3-2) | USB | 261.6 | 1.24 | (c,f) | 0.90 | 1.00 | measured on science target | |
| 1.02 | (c,f) | measured on IRC+10216 | |||||||
| ¹ In general, backend group 1 (-X201 in CLASS) shows higher intensities, and therefore needs to be corrected more, than backend group 2 (-X202 in CLASS) in case important lines are covered by only one of the two backend groups. This effect is strong around 219GHz, but rather weak at other frequencies. In LSB tuning, for 219GHz, group 1 covers C18O and 13CO and group 2 SiO; for 220GHz, group 1 covers 13CO, and group 2 C18O. We estimate the absolute calibration uncertainty - when using different factors for the two backend groups - to 17%. | |||||||||
|
|
||||||||
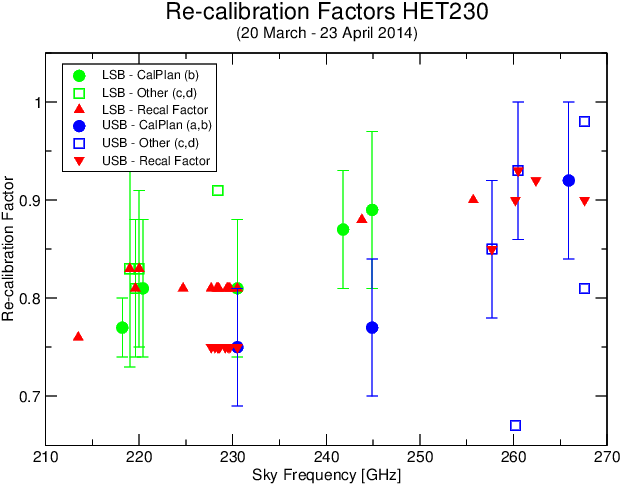
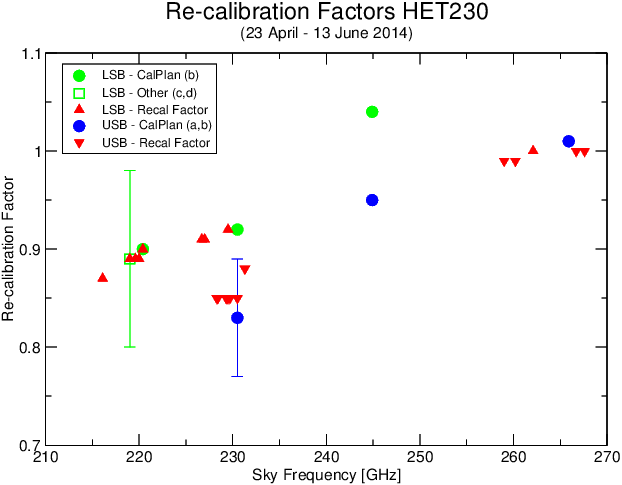
| Fig. 1. Re-calibration factors for APEX-1 as function of frequency. Filled circles represent factors measured on line pointings and calibration plan observations (green: LSB tuning; blue: USB tuning). Open squares represent factors derived during science data, either on calibrators or science targets (green: LSB; blue: USB). Red triangles represent the recommended re-calibration factors for science observations (upward: LSB tuning; downward: USB tuning). | |||||||||
L-AREA.png)
L-AREA.png)
L-AREA.png)
L-AREA.png)
L-AREA.png)
U-AREA.png)
U-AREA.png)
U-AREA.png)
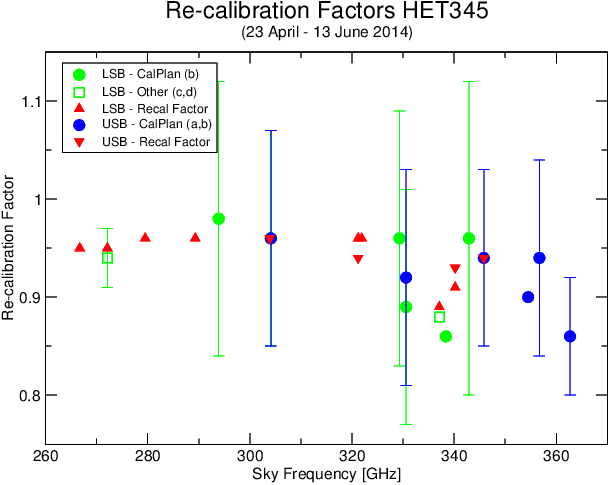
APEX-2 (HET345)
| Frequency | Linename | Sideband | LO Frequency | Intensity ratios | Method | Recommended factor | Comments | ||
|---|---|---|---|---|---|---|---|---|---|
| [GHz] | [GHz] | 20/03-23/04 | 23/04-13/06 | 20/03-23/04 | 23/04-13/06 | ||||
| 266.6 | H15NC(3-2) | LSB | 272.6 | -- | -- | (f) | 0.83 | 0.95 | |
| 266.7 | HCN / HCO+ | LSB | 272.7 | -- | -- | (f) | |||
| 267.6 | HCO+(3-2) | LSB | 273.6 | -- | -- | (f) | 0.83 | 0.95 | not observed |
| 272.0 | HNC(3-2) | LSB | 278.0 | 1.20±0.05 | 1.06±0.03 | (c) | 0.83 | 0.95 | measured on target source |
| 272.2 | 15NNH+(3-2) | LSB | 278.2 | ||||||
| 277.6 | various | LSB | 283.6 | -- | -- | (f) | 0.83 | 0.96 | |
| 279.5 | N2H+(3-2) | LSB | 285.5 | 1.21±0.13 | -- | (d,f) | 0.83 | 0.96 | |
| 289.3 | CO(9-8) (z≠0) | LSB | 295.3 | -- | -- | (f) | 0.90 | 0.96 | |
| 293.9 | CS(6-5) | LSB | 299.9 | 1.08±0.14 | 1.02±0.15 | (b) | 0.93 | 0.98 | not observed in science time |
| 298.3 | 2930SiO7-6 | LSB | 304.3 | -- | -- | (f) | 0.98 | 0.97 | |
| 304.1 | OCS | LSB | 310.1 | 0.92±0.15 | 1.04±0.12 | (b) | 1.08 | 0.96 | not observed in science time |
| 321.2 | H2O(10-9) | LSB | 327.2 | -- | -- | (f) | -- | 0.96 | |
| 321.9 | 13C17O(3-2) | LSB | 327.9 | -- | -- | (f) | -- | 0.96 | |
| 329.3 | C18O(3-2) | LSB | 335.9 | 1.19±0.17 | 1.04±0.15 | (b) | 0.84 | 0.96 | not observed in science time |
| 330.6 | 13CO(3-2) | LSB | 336.6 | 1.38±0.22 | 1.12±0.15 | (b) | 0.72 | 0.89 | not observed in science time |
| 337.1 | C17O(3-2) | LSB | 343.1 | -- | 1.13 | (c) | -- | 0.89 | |
| 338.4 | CH3OH(7-6) | LSB | 344.4 | 1.16±0.13 | 1.16 | (b) | 0.86 | 0.86 | not observed in science time |
| 340.2 | CN(3-2) | LSB | 346.2 | -- | -- | (f) | 0.89 | 0.91 | |
| 342.9 | CS(7-6) | LSB | 348.9 | 1.08±0.18 | 1.04±0.18 | (b) | 0.93 | 0.96 | not observed in science time |
| 345.8 | CO(3-2) | LSB | 351.8 | 1.05±0.14 | 0.78±0.14 | (b) | 0.95 | 1.28 | Unreliable (receiver instabilities) |
| 289.3 | CO(9-8) (z≠0) | USB | 283.3 | -- | -- | (f) | 0.85 | 0.96 | |
| 303.9 | 28SiO7-6 | USB | 297.9 | -- | -- | (f) | 0.98 | 0.96 | |
| 304.1 | OCS | USB | 298.1 | 1.02±0.12 | 1.04±0.12 | (b) | 0.98 | 0.96 | not observed in science time |
| 321.2 | H2O(10-9) | USB | 315.2 | -- | -- | (f) | -- | 0.94 | |
| 330.6 | 13CO(3-2) | USB | 324.6 | 1.25±0.16 | 1.09±0.14 | (b) | 0.80 | 0.92 | not observed in science time |
| 331-334 | CO(3-2) (z≠0) | USB | 325-328 | -- | -- | (f) | 0.81 | 0.92 | Absolute calibration uncertainty: 16%; probably higher when fimg∼325GHz. |
| 337-341 | CO(3-2) (z≠0) | USB | 331-335 | -- | -- | (f) | 0.82 | 0.93 | |
| 340.2 | CN(3-2) | USB | 334.2 | -- | -- | (f) | 0.82 | 0.93 | |
| 345.8 | CO(3-2) | USB | 339.8 | 1.20±0.10 | 1.06±0.10 | (a,b) | 0.83 | 0.94 | |
| 354.5 | HCN(4-3) | USB | 348.5 | 1.20±0.16 | 1.11 | (b) | 0.83 | 0.90 | not observed in science time |
| 356.7 | HCO+(4-3) | USB | 350.7 | 1.15±0.14 | 1.06±0.12 | (b) | 0.87 | 0.94 | |
| 362.7 | H2CO(5-4) | USB | 356.7 | 1.14±0.28 | 1.16±0.08 | (b) | 0.88 | 0.86 | |
|
|
||||||||
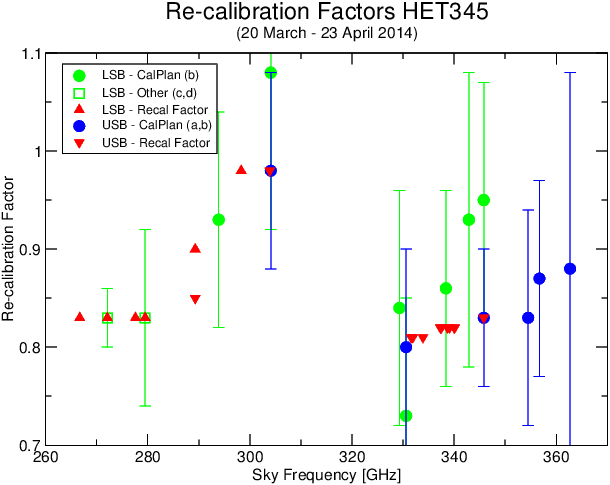
| Fig. 2. Re-calibration factors for APEX-2 as function of frequency. The meaning of the various symbols is explained in the caption for Figure 1. | |||||||||
L-AREA.png)
L-AREA.png)
L-AREA.png)
L-AREA.png)
L-AREA.png)
L-AREA.png)
U-AREA.png)
U-AREA.png)
U-AREA.png)
U-AREA.png)
U-AREA.png)
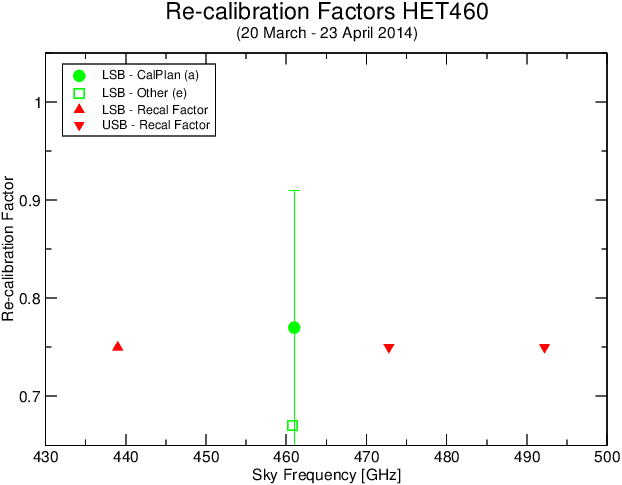
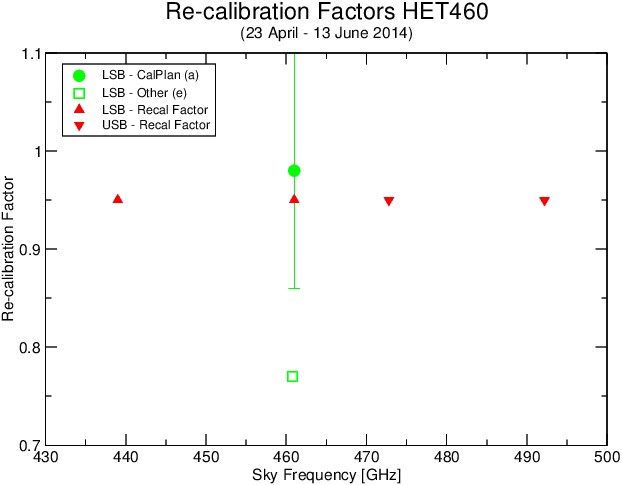
APEX-3 (HET460)
| Frequency | Linename | Sideband | LO Frequency | Intensity ratios | Method | Recommended factor | Comments | ||
|---|---|---|---|---|---|---|---|---|---|
| [GHz] | [GHz] | 20/03-23/04 | 23/04-13/06 | 20/03-23/04 | 23/04-13/06 | ||||
| 439.0 | H2O_439 | LSB | 445.0 | -- | -- | (f) | 0.75 | 0.95 | Factors recommended for all frequencies of APEX-3. |
| 461.0 | CO(4-3) | LSB | 467.0 | 1.30±0.24 | 1.02±0.14 | (a) | |||
| 460.8 | CO(4-3) | LSB | 466.8 | 1.51 | 1.31 | (e) | |||
| 472.8 | H2O_472 | USB | 466.8 | -- | -- | (f) | 0.75 | 0.95 | Factors recommended for all frequencies of APEX-3. |
| 492.2 | CI(1-0) | USB | 486.2 | -- | -- | (f) | |||
| ¹ priv. comm. P. Bergman | |||||||||
|
|
||||||||
| Fig. 3. Re-calibration factors for APEX-3 as function of frequency. The meaning of the various symbols is explained in the caption for Figure 1. | |||||||||
SHeFI Re-calibration Q&A
Q: How do I apply the "Recommended Factor" to my data?
A: You should use the multiply command in CLASS, e.g.:
file out <outputfile>.apex single
find
for i 1 to found
get next
multiply <factor>
write
next
Q: When the affected periods (March to June) are excluded from the data
on calibration sources, does the source intensity remain constant with time
for the remaining data?
A: Unfortunately, not. We have seen intensity changes after receiver
upgrades in the past, or periods with unexplained intensity drops. As a matter
of fact, the performance of SHeFI has improved over the years, with receiver
temperatures nowadays being 50% lower than in 2008. Therefore we believe that
source intensities now are at least as good as in any period before. The
relative intensities (and re-calibration factors) are therefore relative to numbers
obtained after June 2014. This differs from a previous
version of this page, where calibration factors relative to the complete
2008-2014 data set were published.
Q: Why do some factors given here differ significantly from those
given on a previous version of this page.
A: See the previous question. The factors given on an earlier version
were relative to ALL calibration plan data taken from 2008-2014, while the
new numbers are relative to values from after June 13th 2014 only.
Q: By how much did the absolute intensity scale change for data taken
between 2008 and 2013 and data taken after June 13th 2014?
Should I also re-calibrate my pre-2014 data, especially when combining data
from different periods?
A: The changes in the absolute intensity scale - where present - depend on
the observing frequency. An impression of how serious they are can be obtained
from a look at the normalized intensities of calibration plan sources; these
plots are linked in the tables above. Generally, we would recommend not to
re-calibrate any data of projects carried out and finished until 2013.
When combining data from ongoing large projects, however,
a re-scaling of data taken before 2014 may be useful. For the main CO lines,
we can quantify any changes very well from the line pointing monitoring (see
plots for
CO(2-1),
CO(3-2), and
CO(4-3)).
If you wanted to re-scale data from 2013 to the intensity level from after June
2014, the factors to apply would be 1.07, 1.00, and 1.06 for CO(2-1), CO(3-2), and
CO(4-3), respectively. For other frequencies, we may be able to provide such
factors upon request.
Q: Do relative intensities depend on the backend, or the position in the
IF band?
A: For most frequencies, the relative intensities (and therefore the
calibration factors) for both XFFTS groups are rather similar in the area where
they
overlap (i.e. the central 1 GHz of the spectrum). However, we found systematic
differences especially for APEX-1, where the effect of the incorrect calibration
seems bigger for backend group 1 (-X201 in CLASS) compared to group 2. This has
to be taken into account when several lines are covered with one frequency setup
(e.g. C18O(2-1) and 13CO(2-1)). There is also some indication that the effect
is stronger in the center of the band compared to the band edges.
Q: How is the absolute calibration uncertainty affected?
A: An extensive study of the absolute calibration uncertainty we
did a few years ago yielded numbers of 8% and 12% for APEX-1 and APEX-2,
respectively (see
Dumke & Mac-Auliffe, 2010).
Given the additional uncertainty of the re-calibration factor measurements and
estimates, reasonable numbers to assume for the affected periods are
13%, 19%, and 25% for APEX-1, APEX-2, and APEX-3, respectively. Exceptions
to this general rule are mentioned in the table above.
Q: In case I have additional questions, or want to provide some numbers
in order to improve the information presented here, whom can I contact?
A: Please contact
Michael Dumke (ideally
via email) for any requests or issues about this topic.