


APEX-1 characteristics
Receiver Temperatures
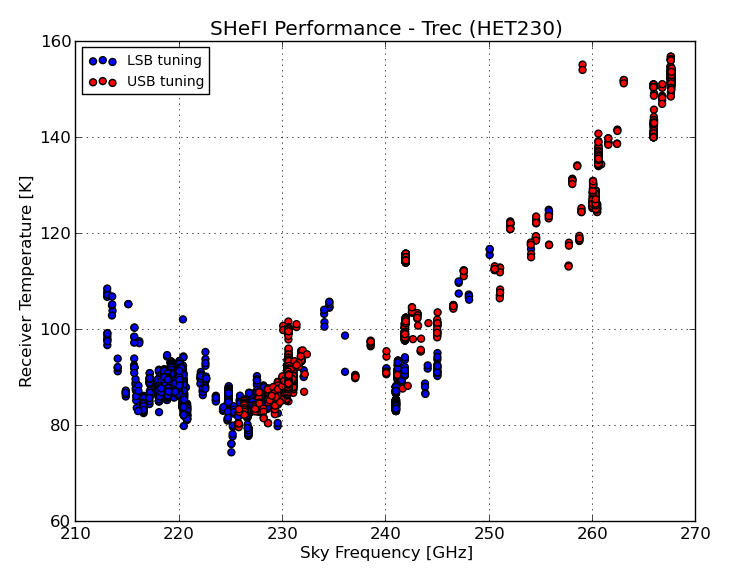
Current performance
The noise temperatures of the receiver are measured continuously by fetching the corresponding information from our observation database. The image below shows the latest results, using data obtained between June 2014 and January 2015.
|
Receiver temperature vs. time
Because of improvements of the receiver, the receiver temperatures now are significant below those measured after the installation in 2008. For selected lines/frequencies (those which form part of the APEX-1 calibration plan), we have collected the numbers since 2008.
| Frequency [GHz] | 218.222 | 220.399 | 230.538 | 230.538 | 241.791 | 244.936 | 244.936 | 265.886 |
|---|---|---|---|---|---|---|---|---|
| Spectral Line | H2CO(3-2)L | 13CO(2-1)L | 12CO(2-1)L | 12CO(2-1)U | CH3OH(5-4)L | CS(5-4)L | CS(5-4)U | HCN(3-2)U |
| Trec vs. time¹ |
L-timevar.png) |
L-timevar.png) |
L-timevar.png) |
U-timevar.png) |
L-timevar.png) |
L-timevar.png) |
U-timevar.png) |
U-timevar.png) |
Just for completeness, we still maintain information about the receiver temperatures measured during the commissioning of the receiver in 2008. Keep in mind that those numbers do no reflect the current receiver performance.
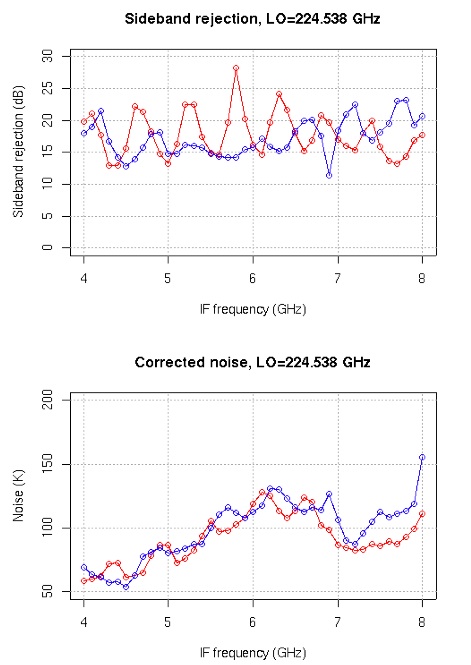
Sideband Rejection
The sideband rejection was measured during the commissioning of the instrument in 2008. It is
generally better than 15dB, depending on frequency.
First measurements had been taken on site with the receiver tuned to the CO(2-1) frequency in
USB. We used a spectrum analyzer and injected a narrow test signal which is moved in frequency
to span the 4-8 GHz of the IF
(Results).
Additional measurements were made on-sky using strong sources and the receiver was tuned
to discrete frequencies, alternatively in LSB and USB to have the line either in the signal
or image band. The results are summarized in the following table:
| Source | Line @ sideband | Signal intensity [K] | Image intensity [K] | Rejection [dB] |
|---|---|---|---|---|
| WB947 | CO(2-1) USB | 40.8 | < 0.1 | > 26 |
| WB947 | CO(2-1) LSB | 46.6 | < 0.1 | > 27 |
| IRAS16293 | 13CO(2-1) LSB | 15.0 | < 0.7 | > 13 |
| IRAS16293 | HCO+(3-2) USB | 17.0 | < 0.2 | > 19 |